Contactors service life
This section reflects the estimated remaining service life estimate of hoisting motor contactors. There are three possible contactor types: for the up and down movements and for fast speed (K1, K2, K3).
The remaining service life a new hoisting motor contactor is expressed as 100%. As the hoist is used, the service life of its contactors starts to trend towards 0%.
| NOTE | This service life calculation is based on theoretical estimation: It cannot be regarded as a direct measurement of the actual condition of the contactors. |
Contactor service life calculation is based on the contactor closing count. The service life of contactors is directly influenced by the usage rate of the hoist and, most significantly, whether the hoist is used in a jogging manner.
If a hoist is used in a jogging manner, it means that the load is lifted in small increments. So, the hoisting motor gets exposed to repeated starts and stops. Jogging particularly wears down the hoisting brake and significantly reduces the service life of the brake and hoist contactors. As a general rule, one hoisting cycle should normally be no more than eight starts. If hoisting cycles repeatedly include more starts, the crane usage should be investigated.
In addition to jogging, peaks in production demands may cause significant reductions in contactor service life. If you spot an unusually steep reduction, you should be concerned about sudden contactor failure that results in crane stoppage.
The recommended action is to change the hoisting motor contactors, if so indicated by the StatusControl data.
Example graphs
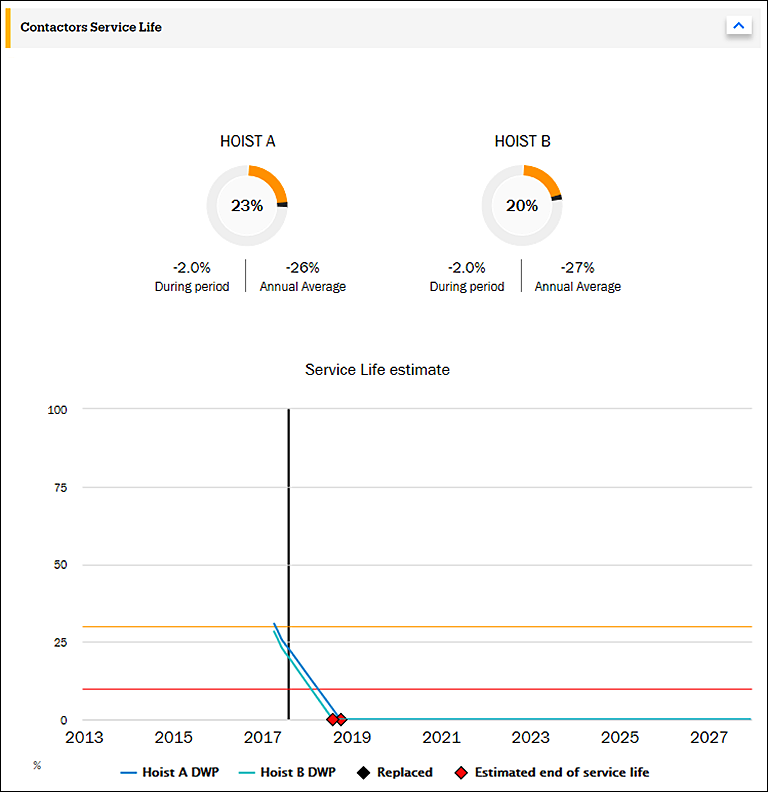
The graphs present the estimated remaining service life percentages of all hoisting motor contactors of the selected crane. Here we have selected a custom time frame extending up to year 2027, so we can see future estimates too.
Pie graph
The pie graphs present the service life situation of the hoisting motor contactors at the end of the selected time frame.
In the example graphs, the service life of the hoisting motor contactors of both hoists had fallen below 30% at the end of the selected time frame. Therefore, both traffic lights are yellow.
Trend graph
The trend graph shows the estimated remaining service life of the contactors from the selected time frame. The values are based on the operating history of the contactors.
In the example graph, the monitoring of the contactors started in 2017, since when the service life of the contactors has been declining steeply. In both hoisting motors, the contactors only have less than 30% of their theoretical service life left, as indicated by the point where the black vertical line (current point of time) crosses the blue line and the green line (estimated remaining service life of the contactors). Assuming that the current type of usage continues, the service life of the contactors is estimated to reach its end in late 2018.