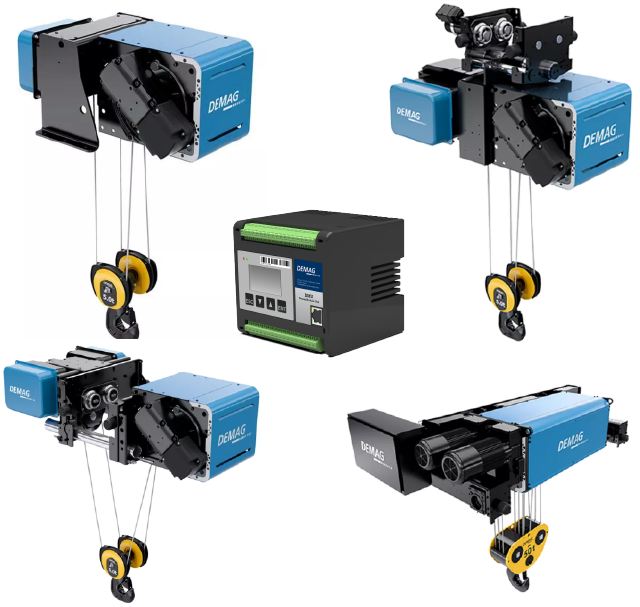
Statistics – DVR hoists with DMU
| NOTE | The statistics data differs depending on the hoist type. Refer to this section if the hoist is a DVR that is equipped with a DMU condition monitoring unit. |
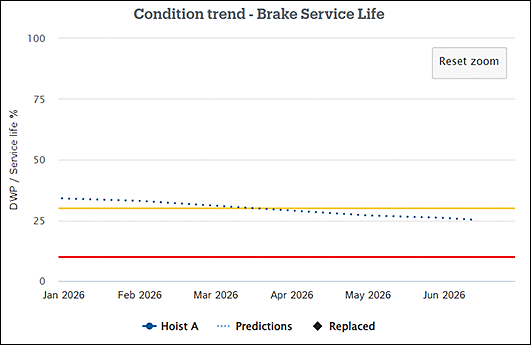
The condition and usage statistics for DVR hoists are visualized in bar graphs and trend lines. In the graphs, the following functions are available for detailed study of the data.
- To view the exact values in a graph, place your mouse pointer (laptops) or
press (touch screens) on the trend line or any bar. An info box opens, presenting
the details for that part of the graph.
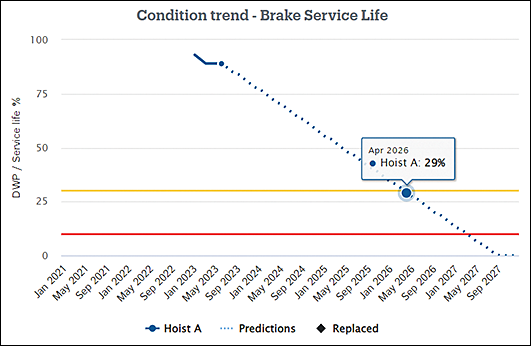
- To zoom in, draw a rectangle with your mouse pointer (laptops) or finger
(touch screens) in the graph. A Reset
zoom button appears, allowing you to get back to the original
graph.