EK service life
These graphs reflect the remaining service life of crab support wheels. The remaining service life of new support wheels is expressed as 100%. As the crab is used, the service life of its support wheels starts to trend towards 0%.
| NOTE | This service life calculation is based on theoretical estimation: It cannot be regarded as a direct measurement of the actual condition of the crab support wheels. |
The most likely reason for an unusually fast decline in the crab support wheels service life is continuous crab operation. In that case, you should be concerned about premature wear or failure of the support wheels. Wear increases the degree of inertia during movement and may eventually lead to a situation where the crab cannot be moved at all. The recommended actions are as follows:
- Always perform regular inspection and maintenance as recommended by the manufacturer or as required by applicable regulation.
- When the StatusControl graphs reflect a yellow warning level, schedule support wheel replacement.
- When the red alert level is indicated (10% of service life remaining), change the support wheels. The change interval is 750 km (470 mi).
  | |
Example graphs
The graphs present the remaining service life percentages for the support wheels of all crabs of the selected crane. Here we have selected a custom time frame extending up to year 2027, so we can see future estimates too.
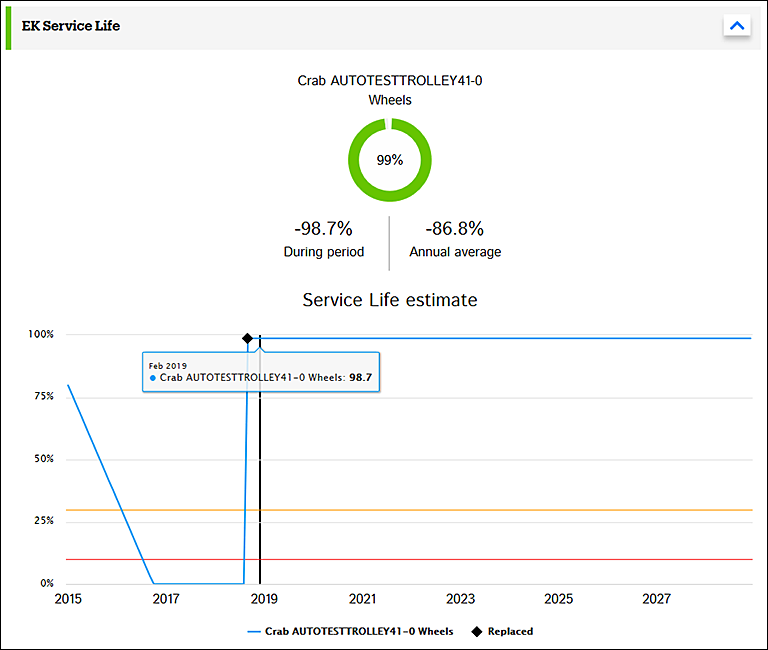
Pie graph
The pie graphs present the service life situation of the crab support wheels at the end of the selected time frame.
In the example graph, the crane has one crab. At the end of the selected time frame, the support wheels of the crab had 99% of their theoretical service life left. Therefore, the traffic light is green (above 30%).
However, the service life of the crab support wheels had reduced significantly during the selected time frame, and the annual average reduction has also been drastic.
Trend graph
The trend graph shows the theoretical remaining service life for the support wheels of each crab from the selected time frame. The values are based on the operating history of the crabs.
In the example graph, the support wheels currently have 98.7% of their theoretical service life left, as indicated by the crossing point of the black vertical line (current point of time) and the blue line (remaining service life of the support wheels). In 2015, the service life of the crab support wheels had fallen below the yellow 30% warning level and in 2016 below the red 10% alert level. Therefore, the crab support wheels were replaced recently, as indicated by the small black square. At the moment, the warning or alert levels are not in sight.