Brake service life
These graphs reflect the remaining service life of all hoisting and traveling brakes of the selected crane. The remaining service life of a new brake is expressed as 100%. As the brake is used, its service life starts to trend towards 0%.
| NOTE | This service life calculation is based on theoretical estimation: It cannot be regarded as a direct measurement of the actual condition of the brake. |
The service life calculation of brakes is based on the number of starts of the hoisting and traveling motors. Common causes for an excessive number of starts include continuous operation of the hoist, particularly when jogging is involved.
If a hoist is used in a jogging manner, it means that the load is lifted in small increments. So, the hoisting motor gets exposed to repeated starts and stops. Jogging particularly wears down the hoisting brake and significantly reduces the service life of the brake and hoist contactors. Jogging also affects traveling brakes.
As a general rule, one hoisting cycle should normally be no more than eight starts. If hoisting cycles repeatedly include more starts, the crane usage should be investigated.
If you spot an unusually steep decline in a brake service life, you should be concerned about premature brake wear or even a serious brake failure.
Example graphs
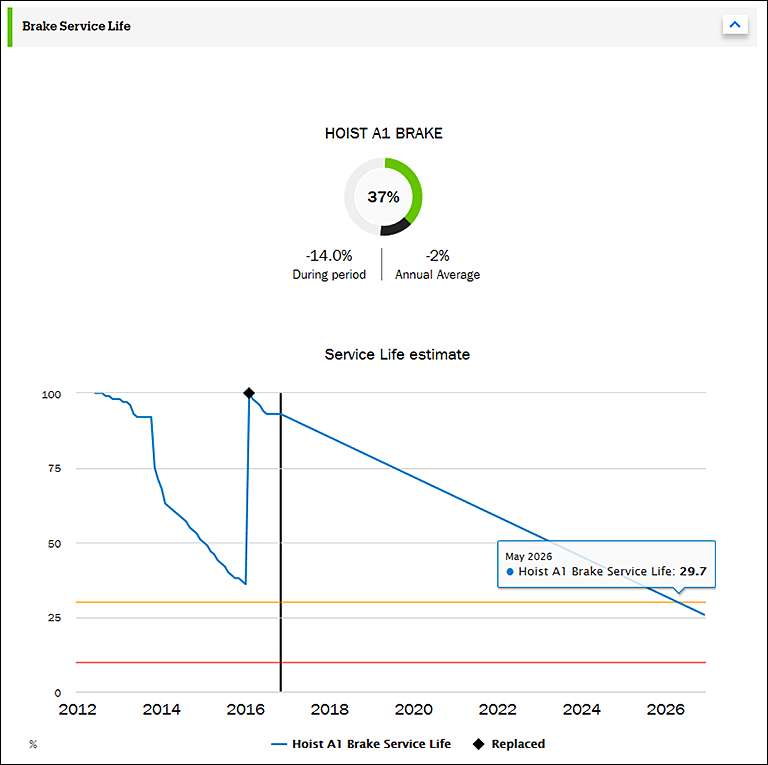
The graphs present the estimated remaining service life percentages of all hoisting and traveling brakes of the selected crane. Here we have selected a custom time frame extending up to year 2026, so we can see future estimates too.
Traffic lights indicate the estimated remaining service life percentage as follows.
| Traffic light | Remaining DWP | Meaning | Required actions |
|---|---|---|---|
| Green | 100%–30% | Ok | Always perform regular inspection and maintenance on the brakes, as recommended by the manufacturer or as required by applicable regulation. |
| Yellow | 30%–10% | Warning level | Review the estimated remaining service life and plan maintenance actions. |
| Red | 10%–0% | Alert level | Tag out the crane.
|
  | |
Pie graph
The pie graphs present the service life situation of the brakes at the end of the selected time frame.
In the example graph, the estimated remaining service life of the hoisting brake was 37% at the end of the selected time frame. Therefore, the traffic light is green (above 30%). However, the service life of the hoisting brake reduced quite significantly (14%) during the selected time frame, as illustrated by the black portion in the graph and the text below it.
Trend graph
The trend graph shows the estimated remaining service life of each brake from the selected time frame. The values are based on the operating history of the brakes.
In the example graph, the brake was recently replaced, as indicated by the small black square. Therefore, the brake now has more than 90% of its theoretical service life left, as indicated by the crossing point of the black vertical line (current point of time) and the blue line (estimated remaining service life of the brake). Assuming that the current type of usage continues, the service life of the brake is estimated to fall below the yellow 30% warning level in 2026. The end of the theoretical service life is not yet in sight.