Load
The Load section presents data about the loads that the crane has handled during the selected timeframe.
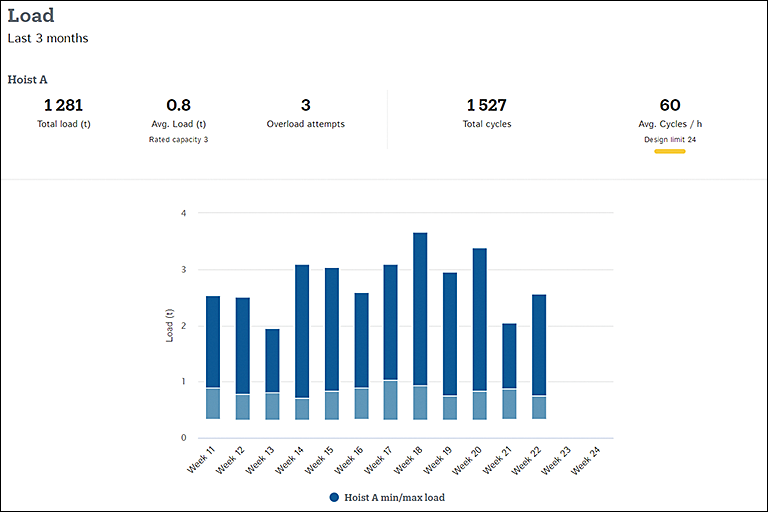
Above the graph, the following values are shown.
- Total load: Total weight of the loads that the crane has handled during the selected timeframe.
- Avg. load: Average weight of a load that the crane handles during one lift. Below the average load value, the rated capacity of the hoist is given as a reference.
- Overload attempts: Number of overload attempts from the selected timeframe. An overload attempt occurs when the lifted load exceeds the rated capacity of the hoist by 10% for a certain time. At that point, the condition monitoring unit prevents the lifting motion.
- Total cycles: Total number of hoisting cycles from the selected timeframe. In practice, one hoisting cycle corresponds to one lift with a load.
- Avg. cycles / h: Average number of hoisting cycles in an hour.
The Avg. cycles / h value is compared to the respective design limit, which is presented below the average. The following table reflects the design limits for hourly cycles, with respect to the design class of the hoist.
| Class | ISO/AS | FEM | CMAA | Cycles/h |
|---|---|---|---|---|
| 3 | M3 | 1Bm | A | 25 |
| 4 | M4 | 1Am | B | 30 |
| 5 | M5 | 2m | C | 40 |
| 6 | M6 | 3m | D | 50 |
| 7 | M7 | 4m | E | 60 |
| 8 | M8 | 5m | F | 60 |
Design limits should not be exceeded in normal operation. If the design limit has not been exceeded during the last three months, the indicator color below the value is green. If the design limit has been exceeded, the color turns yellow. Yellow color indicates the hoist being over-worked compared to its design, causing its service life to shorten faster. If the Avg. cycles / h exceeds the design limit, pay attention to the inspection of the hoist structures, such as the steel structures and the hook block.
The bar graph visualizes the loads that the crane has been handling over the selected timeframe. The height of a bar reflects the load variation for the indicated point of time, from the top maximum to the bottom minimum.
The white divider within a bar marks the average load. Loads above the average have a darker color, while loads below it are shown in a lighter tone.