Condition prediction
The Condition prediction section presents how the condition of a selected component has developed in the past and how it is likely to develop in the future.
The graph shows one component at a time, the hoisting brake by default. You can change the component with the drop-down menu top right.
The condition of the selected component is presented as DWP% (design working period). DWP% is an overall value that reflects the remaining theoretical service life of the component.
The following DWP% values are typically available, depending on the type of the crane and hoist.
- Hoist DWP. Shows either the DWP% for running time (DWPRT%) or the DWP% for hoisting cycles (DWPHC%), whichever is lower. That way, the value is affected by running hours, hoisting cycles, and loads.
- Hoisting machinery DWP. Presents the DWPRT% value, which is based on the running time of the hoisting motor. Indicates the effects of running time and loads on the rotating machinery of the hoist.
- Trolley steel structure DWP. Presents the DWPHC% value, which is based on the number of hoisting cycles. Indicates the effects of hoisting cycles and loads on the steel structure of the hoist.
- Brake service life. Indicates the estimated remaining service life of the hoisting brake. Based on the number of hoisting motor starts and the number of emergency stops and abnormal stops that are issued during lifting and lowering motions.
- Brake controls. Indicates the estimated remaining service life of the hoisting brake controls.
- Contactors service life. Indicates the estimated remaining service life of the hoisting motor contactors. Based on the maximum closing count that has been specified for typical motor contactors that are used in Demag hoists. The service life of contactors is directly influenced by the usage rate of the hoist and, most significantly, whether the hoist is used in a jogging manner.
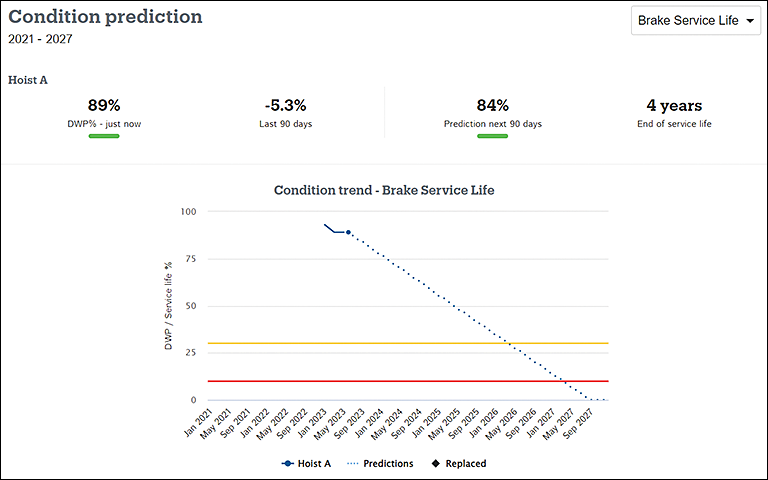
Above the graph, the following values are shown for the selected component.
- DWP% - just now: Current remaining DWP%.
- Last 90 days: Change in the DWP% during the last 90 days. Usually the change is negative (such as -5.1%), referring to a reduction in the service life owing to usage. But, the change can also be positive (such as 5.1%), meaning that the component was changed during the reporting period.
- Prediction next 90 days: Prediction for the remaining DWP% after the next 90 days.
- End of service life: Estimated end of service life in days, months, or years.
In the graph, the timeframe is fixed to seven years: In addition to the ongoing year, two years are taken from the past and four years are predicted into the future. The blue dot indicates the current point of time.
The blue trend line presents the past and future condition of the selected component as DWP%. The solid part of the trend line reflects the actual condition up until today. The dotted part is the prediction.
In the predictions, the assumption is that the current type of usage continues. The predictions are updated dynamically according to changes in usage.
The horizontal red line reflects the critical point where the DWP% falls under 10%. The yellow line marks the point for the low condition with 30% of DWP left.
If there is a small black square in the graph, it marks the point of time when the component was replaced. The service life calculation of the component starts over at that point.