Operation hours
There are three graphs, presenting the operating hours of the crane and all its machineries. Operating hours include all hours during which control voltage has been supplied to a motor: So, the motor shaft does not need to be rotating for the hours to accumulate. You can use the operating hours data for usage-based maintenance planning.
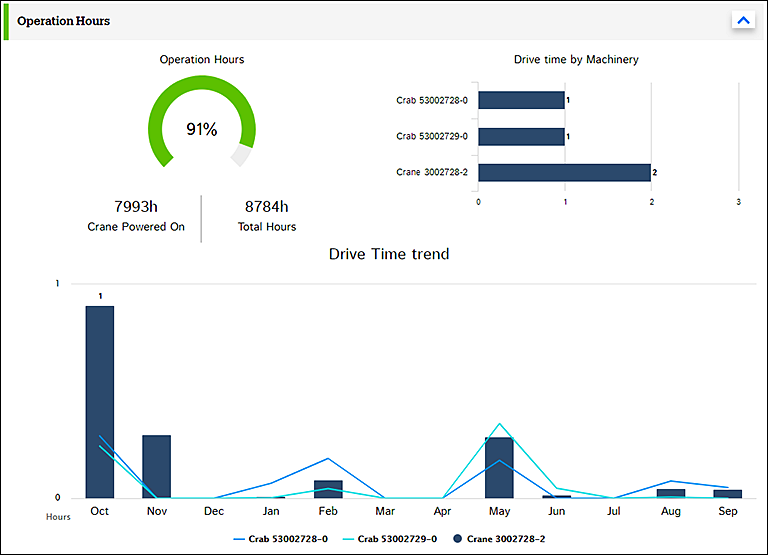
The pie graph on the left presents the cumulative operating hours of the entire crane from the selected time frame. The operating hours are compared to the total number of hours on the clock, which gives you an idea of the usage rate of the crane. The status color is always green.
The bar graph on the right shows the operating hours of all hoists and crabs of the selected crane from the selected time frame. The “Crane” bar reflects the cumulative operating hours for the entire crane: It is a sum of all the other bars.
The trend graph provides an easy way to examine machinery-specific operating hours and the possible asymmetrical operation of different machineries. If only one of a pair of hoists is frequently used, it reaches the end of its service life much faster than the unused hoist. By default, the data is shown from the last 12 months, counting backwards from today.
There are no warning or alert statuses for operating hours: The traffic light is always green (or gray if the crane is offline).