Interpreting the data
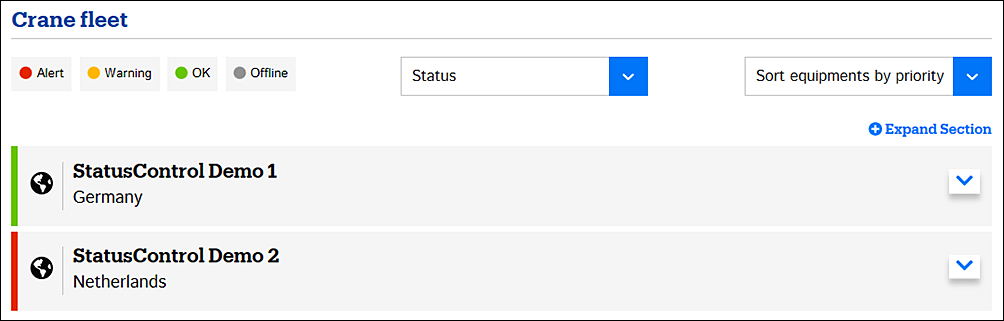
The Fleet view shows the overall status of all the cranes of the selected customers with traffic-light type of color-coding. By default, a collapsed mode is visible: The data is shown by customers, indicating whether the StatusControl service has detected problems in any of their cranes.
| Status color | Explanation |
|---|---|
 | No problems detected. You can continue using the crane normally. All statutory inspections and regular maintenance actions are still necessary. |
 | Moderate or incipient problems detected. Go to the Single crane view by clicking or tapping the crane box and check the reason. |
 | Severe problems detected, immediate actions needed. Go to the Single crane view by clicking or tapping the crane box and check the reason. |
 | No data available. The crane is offline: It has not sent any data for the past 24 hours. For more information, see Troubleshooting. |
The status colors are based on all the condition and usage values that the StatusControl service collects from the cranes. These values are visible in more detail in the Single crane view.
In the collapsed mode, the overall status color reflects the worst case: If any crane is red, the overall status is red, irrespective of any other statuses. If there are no red statuses, StatusControl checks for any yellow statuses: If even one yellow status is found, the overall status becomes yellow. Next, gray statuses are checked in the same way. If no red, yellow, or gray statuses are present, the overall status reflects green.
You can expand the view to show the status of the individual cranes. To expand one customer, click anywhere in the customer name bar (4). To expand all customers at once, use + Expand Section (5).
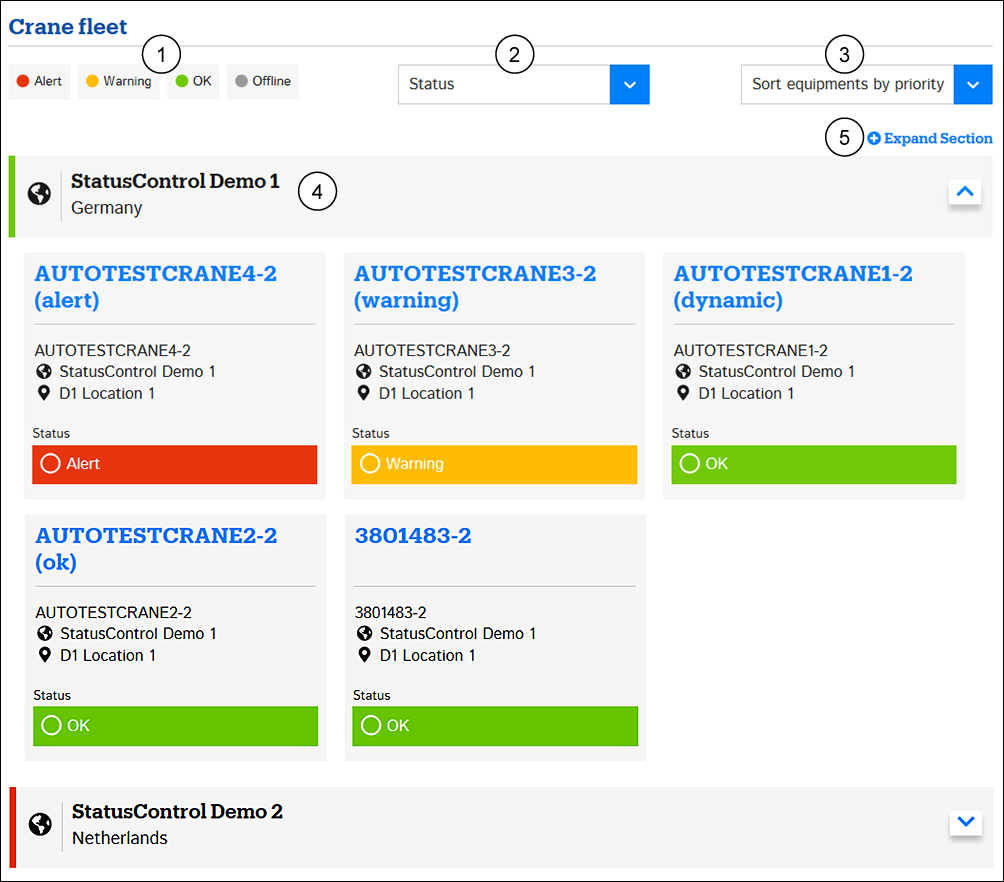
- Status filter
- Status or condition value selection
- Sorting
- Customer name bar
- Expand all
You can filter the view by crane status. Pick a status (1), and the view starts to reflect only such cranes that currently have the selected status. Selecting the red status allows you to quickly spot and concentrate on any cranes that require immediate attention.
You can also select a specific condition value (2) by which you want the statuses to be shown. For example, if you select Brake service life, the traffic lights start to reflect the brake service life status for all cranes.
By default, the cranes are shown in priority order: The ones with the most alarming status are placed at the top. You can also sort the cranes by alphabetical order (3).
Each crane fleet gets sorted at one go. You cannot sort customers.